Real Time Tracking Plot - VBTrack
Please send email to Tom Carrico with your comments
VBTrack
VBTrack plots the RA and Dec tracking errors output by MaxIm. It also shows the rms values of the error over time as well
as other statistics about tracking performance. Its purpose is to help you understand how your mount tracks, make adjustments to tracking parameters, mount balance, etc and
quickly see how those changes affect tracking performance. It currently supports the ST-4, SBIG 7-10, ST-2000 and any other camera that reports tracking errors to MaxIm.
. Figure 1 shows how it looks running on top of MaxIm.
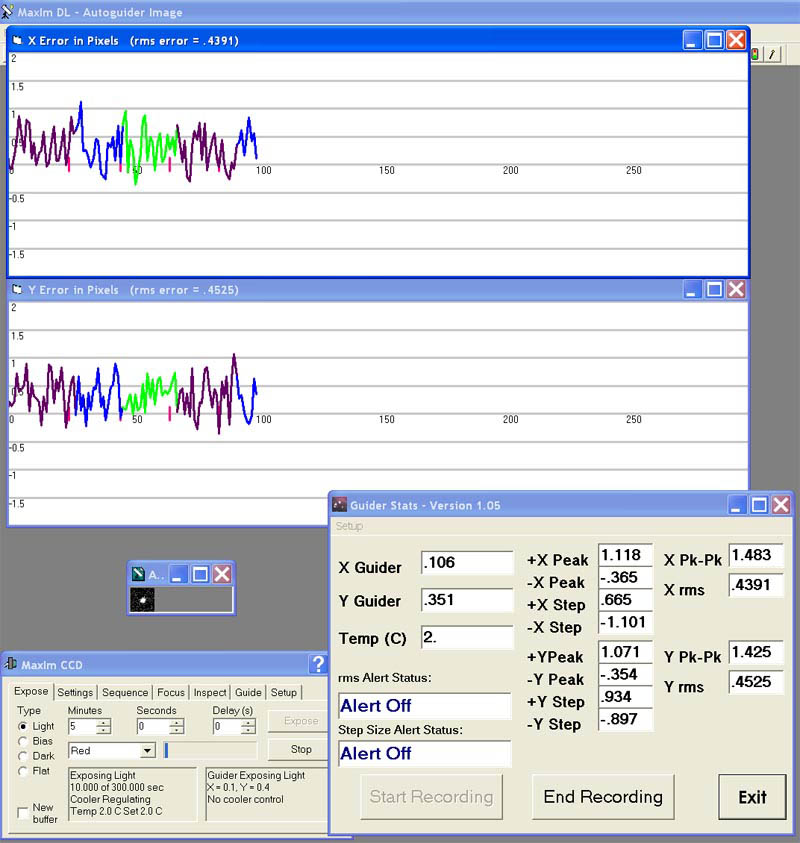
Figure 1 - VBTrack and MaxIm
The top plot shows the "X Error", the bottom plot the "Y Error" as reported by MaxIm. Also, in the caption area the rms error for each axis
is updated and reported in real time. In this image, X is declination. For your setup, it depends on the orientation of the CCD. The
plot is of each error as reported by MaxIm. VBTrack does not send anything to MaxIm or your mount, it merely reads the X and Y guider
errors from MamIm. While the points are plotted equally spaced, they are not equally spaced in time. This is because the time between
corrections can be different for each point.
The different colors represent different sequences. Whenever a new sequence is started, the color changes to let you know. The colors cycle between
three different colors.
Hidden behind the two plots is the main window. Figure 2 shows all the information available from this window.
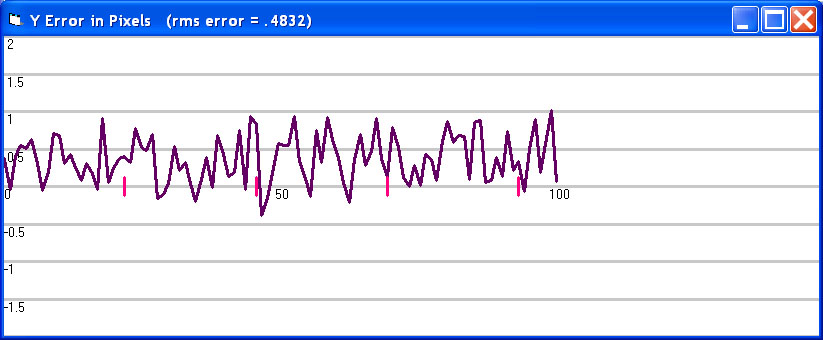
Figure 1a - Y error graph showing 1 minute time ticks
In Figure 1a, you can see light red tick marks. Each tick mark is one minute apart, so it is a bit easier to see how far along
you are in an exposure, as well as see patterns that may be periodic in nature. Note that the numbers on the x-axis represent each guider error, so they may not be
equally spaced in time. This is why the tick marks are drawn.
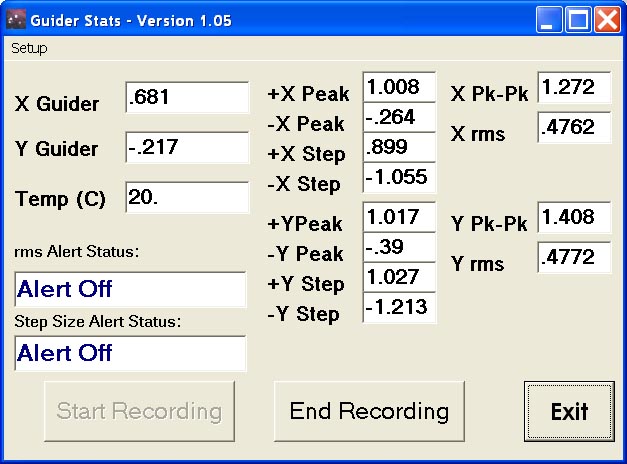
Figure 2 - VBTrack information window
Most of the information is easy to figure out. All units are in pixels, unless you enable scaling in the Setup menu. I have found the most useful parameter is the rms value. It is an indicator of how good (or bad) the tracking is. The
smaller the rms, the better the tracking and the better your star images will be. With my G-11/Gemini, if the RA rms is below about .15 pixels I will have nice round stars. The Alert windows
in the lower left will give you an alert if the the deviation or rms values are larger than user set limits. A sound also goes off, a beep-beep-beep, so you will wake up
in case you have dozed off. VBTrack does not stop the image, it just alerts you that the tracking performance, as defined by you, has degraded, and you may want to
abort this image instead of wasting time waiting for it to complete. Figure 3 shows the Setup window for setting alert values.
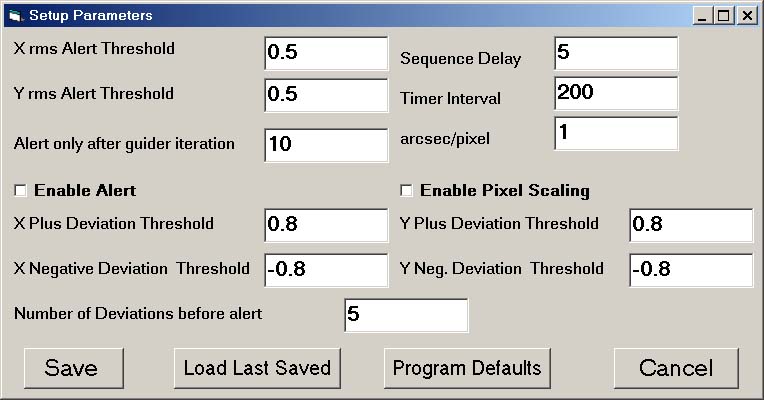
Figure 3 - VBTrack Alert Parameter Window
The default values are ones that I have found to be indicators of poor tracking performance. That is, if I use these values and the mount guiding exceeds any of them, my
stars will probably not be round. You will have to experiment to determine the values for your mount.
- X rms alert - Will alert if X axis rms exceeds this value.
- Y rms alert - Will alert if X axis rms exceeds this value.
- Alert only after guider iteration - Wait for the guider to settle this many guide intervals before checking.
- X plus/minus deviation - If a guiding step exceeds this value, indicating a jump by the mount in the plus or minus direction, increment the deviation counter
- Y plus/minus deviation - Similar to X
- Number of deviations before alert - How many X or Y deviations (or jumps in tracking) before alerting the user. Also waits for Alert only after guider iteration before starting to count
- Sequence Delay - How long the program will wait, in seconds, with no new guider information before assuming the next image in a sequence, if you are taking a sequence, has started.
The plot will change color for each image in a sequence, as well as reset the statistics at the start of each image. If you have a parallel port camera, you can
leave this at 5 or 10 seconds. If you have a USB ST-8/10/2000, set this to around 8 seconds. For faster downloading cameras, leave it at 5 seconds.
- Timer Interval - How often the program checks to see if a new guider measurement is ready, in milliseconds. For slow computers, less than 200 MHz, you may have to
increase this number to 300 or 400 so that it does not bog down your computer.
- arcsec/pixel - If you put in the size of your pixels in arcsec, the plot will be in terms of arcseconds
- Enable Pixel Scaling - You must check this box if you want the plot to be in terms of arcseconds. Also, once you have started
plotting the data, you cannot disable (or enable if you were not scaling), unless you end recording and then return to this menu.
- Enable Alert - Check if you want to enable the alerts.
- Save - Enables the values you entered and stores them in a file called config.txt
- Load Last Saved - Reads the values that were last saved. Helpful if you had set up a bunch of parameters. The program always loads with its default values.
This also saves the values used in the scaling of the X and Y plots. However, to enable the X and Y parameters, you must double click on each of the graphs
(you will see the just loaded parameters) and teh click Redraw Graph.
- Program Defaults - Resets all the values to the program defaults. Use if you want to get back to what was used when the program started.
- Cancel - Undo anything you entered since you opened this window.
If you double click on either graph, a window like Figure 4 pops up, allowing you to change the scale of the graph. You can also move the windows
around and resize them if you have limited display space. When you click the Save button in the Setup menu, the values used to change the scale of the graph
is saved as well. When you click Load Last Saved in the Setup menu, the last saved values will be loaded, but you must click Redraw graph to enable them.
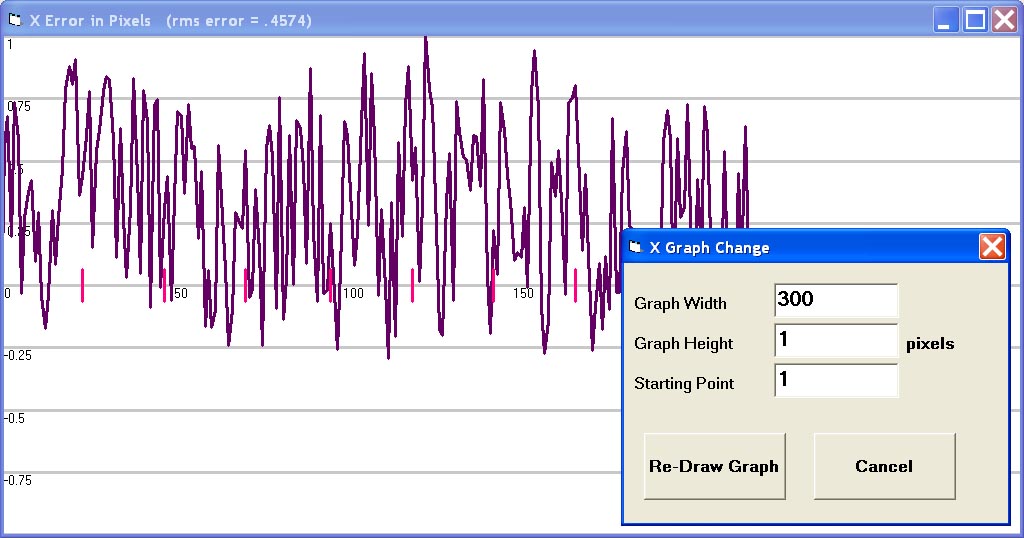
Figure 4 - Window used to re-scale images
VBTrack stores the data it plots. When you hit the end recording button, a window will pop up and ask if you want to save the data. If so, you will be able
to save a .txt to the directory you installed to. Figure 5 shows a sample file. The first column is the X correction, the second is the Y correction and the
third column is the number in the sequence. If you do not take a sequence, the third column will always be 1.
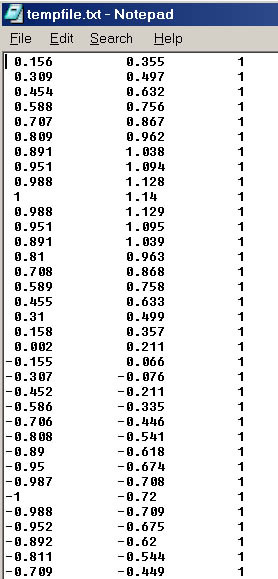
Figure 5 - Sample of data that is saved
Downloading VBTrack:
Download VBTrack.zip
(about 1.6 MBytes) into any directory you want. It will default install into a directory called C:\VBTrack. However, you can install it where you want. Here are the basic steps for successful operation:
- You MUST start MaxIm before starting VBTrack
- Acquire a guide star and start tracking.
- Start VBTrack - You can find it in your start menu
- Click the VBTrack Setup menu and make any changes or enable alerts or pixel scaling. When you just start out, leave alerts off, they may end up annoying you
- Click the Start Recording button
- Watch your tracking, doubleclick on the graphs if you want to change the scale
- When you are finished, or just want to clear the graph, click End Recording. Save the data if you want
- VBTrack looks best when displayed with a video resolution of 1024x768 or higher
Installation Notes:
- Uninstall the old version of VBTrack before installing the new version
- I have tested VBTrack on Windows 98/ME and XP Home running version 3.07 and 3.21 of MaxIm. It is a pretty benign program and should have
no ill effects on your computer.
- I recommend you un-install older version of VBTrack before re-installing new versions
Release Notes:
- Current version is 1.05. It fixes numerous errors and adds the rms error into the caption
- One so far unsolvable bug is the first time you double click on a graph, you will get the redraw menu. If you click on cancel and then use the mouse
to change the size of the window, you will get a runtime error. However, if you just hit Redraw Graph, without changing any values, it will work fine and handle
a Cancel from that time on in the program.
- You can still get a run time error if you re-size (by dragging its border) a graph window so that its y-size is zero.
If you want to make the window that small, just minimize it
- If you have any questions, please send me an email.